1. Finding the Levers
Our choice of diet is deeply personal, yet other than for weight loss, we rarely give it our full consideration. Our default options are usually defined by our upbringing. This varies through life, often influenced by what has been marketed most effectively, whether through direct advertising or by example. Through my research I have found that diet is the most powerful lever available to just about everyone to affect substantial positive changes in our own lives, and the lives of others. This post aims to demonstrate just how extensive some of those effects can be.
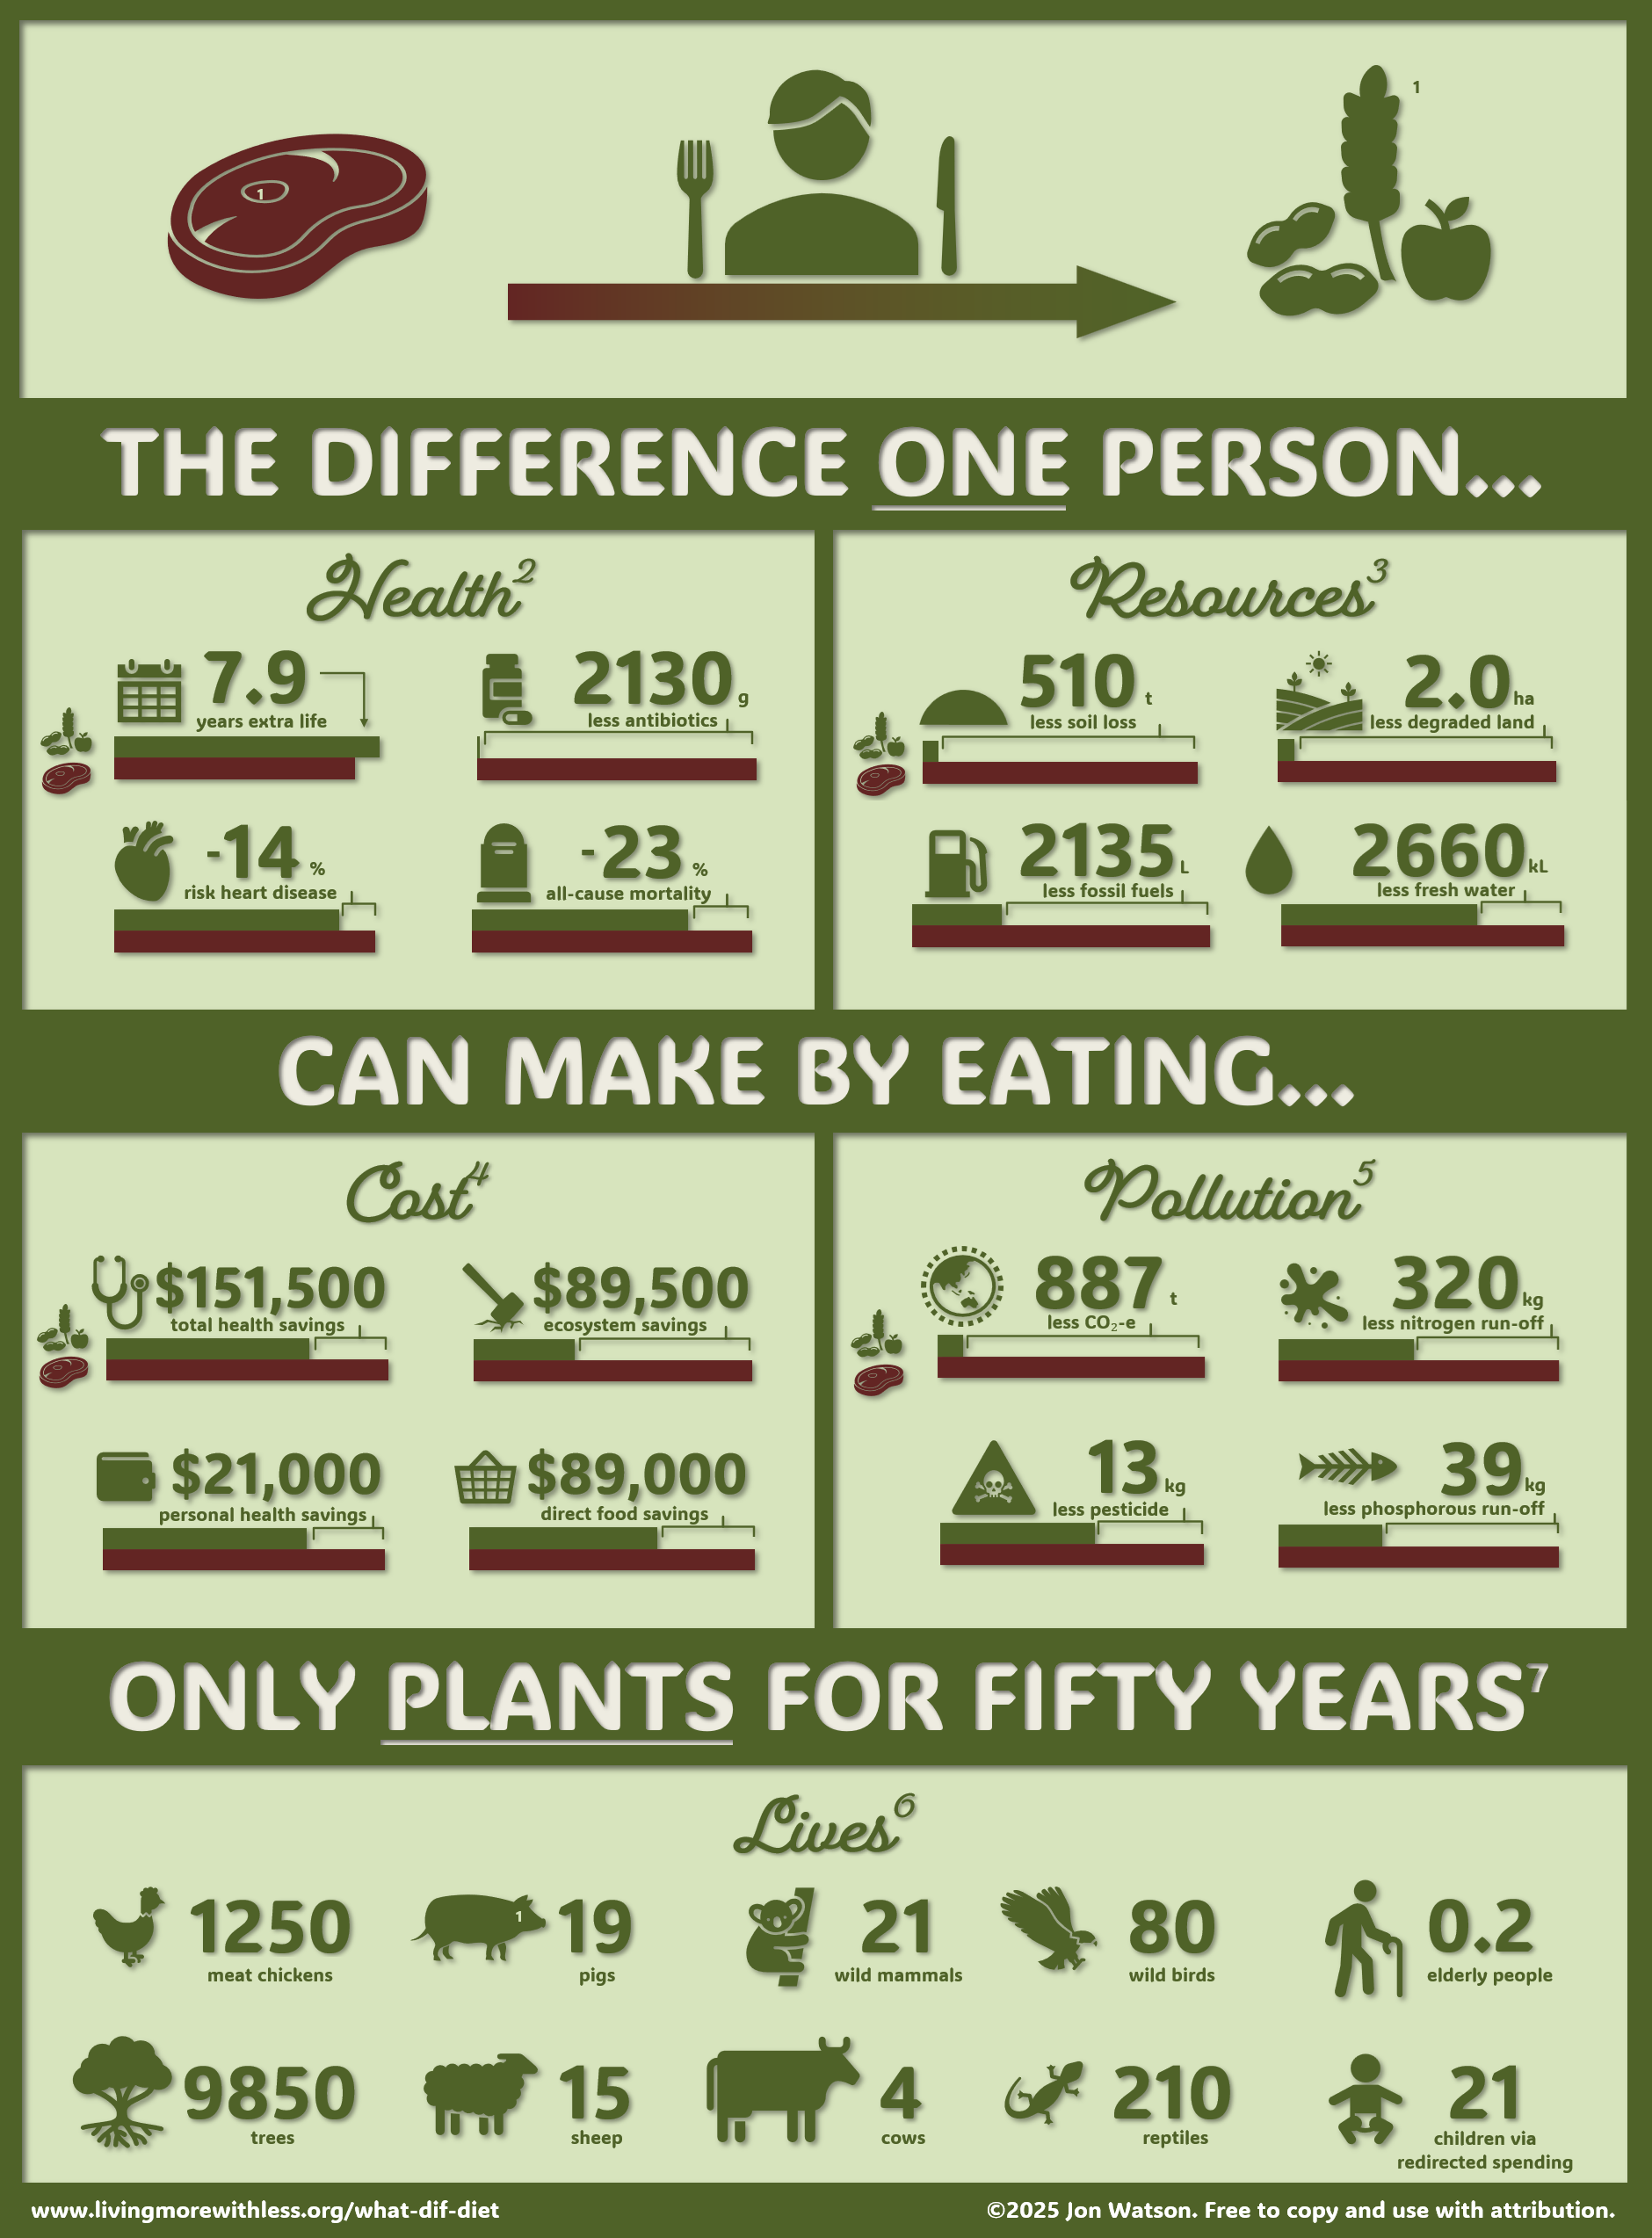
Most people accept that a change in diet could extend their life by a few years. But what does that ideal diet look like? Fewer may realise that it could also help cut about a quarter of their healthcare expenses. Or that it could prevent the destruction of habitat that is home to hundreds of animals. Fewer still may be prepared to accept there are human lives on the line. It is easy enough to find studies demonstrating some of these benefits, but I could not find anything putting everything together. So here I set about doing it myself. Below you will see the result.
Everything, of course, is presented on a statistical basis. There is no guarantee of any of the outcomes, except perhaps direct food costs. Where uncertain I have erred on the conservative side. This means potential impacts may be even greater for some of the figures.
1. Attribution for artwork
Most icons from the Microsoft collection except for the following, from the Noun Project:
- Steak by Abdul Latif
- Wheat by Muhammad Nur Auliady Pamungkas
- Peanut by Arthur Shlain
- Pig by Bakunetsu Kaito
Arrangement and formatting by Jon Watson.
2. Health
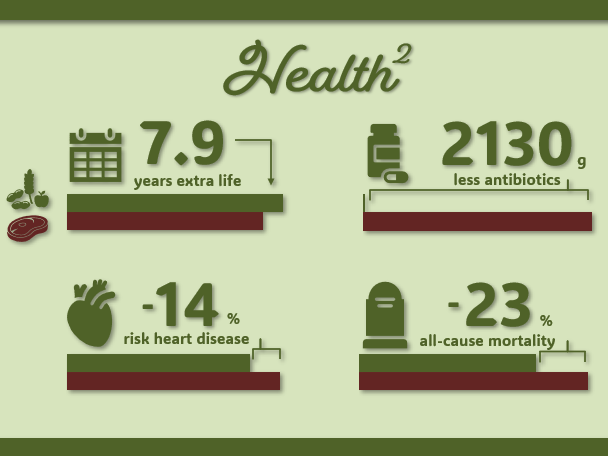
I feel this is likely to be the most personal and relatable of the impact categories for many readers. Health is also an established motivator for dietary changes of any kind.
Longevity
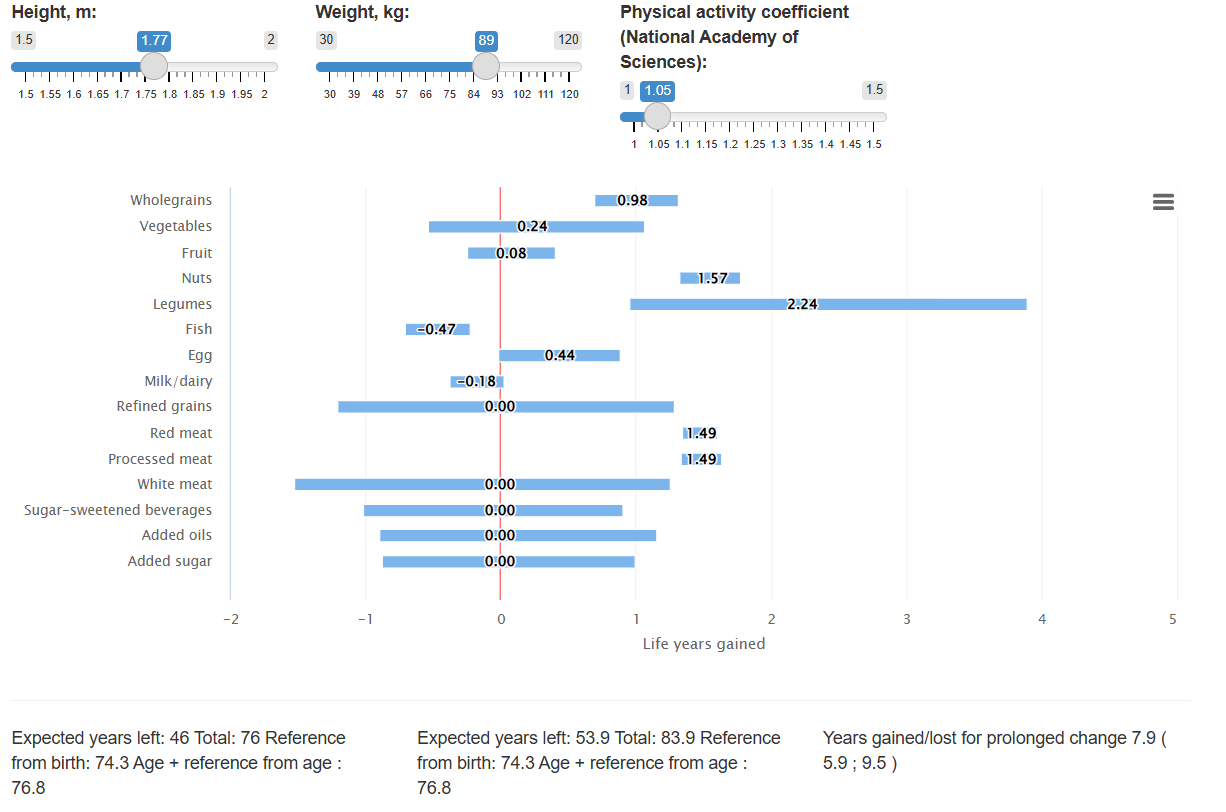
The increase in life expectancy is calculated with a tool developed by Lars Fadnes and his colleages at the University of Bergen, Norway.1 They extracted dose sensitivity data for a range of dietary elements, based on 250,000 nutrition related papers. The increased life expectancy reported is based on the following attributes:
- 30 year old male
- average height & weight for Australia
- Estimated (low) activity level
I adjusted the baseline to Australian average consumption. Then maintaineing energy and approximate macronutrient balance I made the following adjustments in diet:
- Increase in legumes, whole grains and nuts
- Decrease red meat, processed meat and eggs.
- No change intake of refined grains, added oils, sugar or sweetened drinks
The final point explains why their estimated impact straddles zero in the image below. The authors report inadequate high quality data for white meat, so it’s impacts are excluded.
I invite the reader to explore the tool to better understand the impacts of a range of choices. A long life is, of course, not necessarily a good life. On the other hand while life is good, having more of it is a welcome idea.
Antibiotics
The figure presented is based on a 99% reduction in agricultural and aquaculture antimicrobial use. The remaining 1% has been allowed for non-food animals. Total non-human use has been estimated at 100 thousand tonnes per year (range of 73 to 130kT/yr)2. This figure was divided by a global population of 7.8 billion people. I was then scaled based on the particulars of the Australian diet. The first adjustment is due to the vastly greater meat intake of Australians. This is approximately 2.1 times the global average as shown below.
The second adjustment is due to the high specific rate of antibiotic use in Australian agriculture. This is approximately 1.6 times the global average.3 Approximately 89% of the food consumed in Australia is locally produced.4 Thus it is reasonably safe to assume this food will have the same, higher antibiotic concentration than the global average.
There is a reasonable concern about the long term impacts of excessive antibiotic use on human health. Less consideration has been given to impacts on the non-human environment. In addition to antibiotic resistance in humans and healthcare environments, their widespread use has the potential to impact the natural cycles of carbon and nitrogen. Their presence affects soil composition by selection pressure on the soil biota, where the antibiotics accumulate via manure.5
A global shift to a plant based diet would reduce antibiotic use by approximately 72%. The balance remaining in use would be for the treatment of infection in humans and their pets.6
Disease & Mortality
Researchers at Harvard followed the dietary habits of over 200,000 US health care professionals for up to 34 years. During that time they recorded approximately 50,000 deaths7. They ranked the actual diets of each individual every 4 years against the EAT Lancet reference diet on a 140 point scale. The participants were divided into five groups based on conformance to the ideal diet. Once adjusted for confounding factors, the hazard ratio between the 1st and 5th quartile to be 0.77 for all cause mortality and 0.86 for cardiovascular mortality respectively. This gives rise to the 23% and 14% risk reductions noted on the infographic.
It is important to note the healthiest participants in the study are not strictly vegan. The reference diet includes optional some white meat and animal derived products. The core elements of the reference diet are legumes and whole grains. Thus, those scoring highly on this scale would also sustain health benefits from reduced intake of sugar and saturated fat. The lowest quintile is, however, is quite reflective of average Australian consumption patterns.
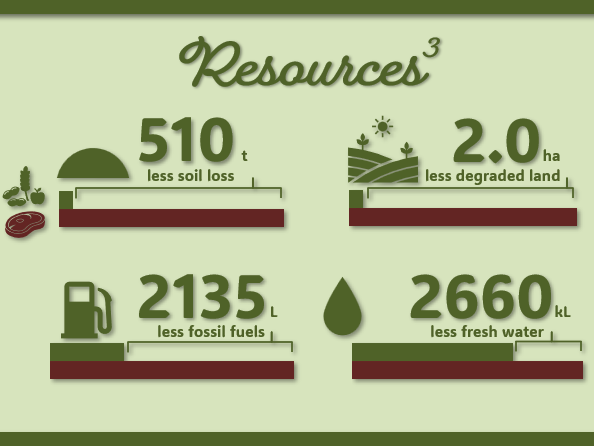
3. Resources
Land Degradation
The Australian diet is extraordinarily land-intensive, primarily due to the beef and lamb content. Globally, agriculture currently occupies approximately half of all habitable land. If everyone were to adopted the ruminant rich Australian diet it would take all the habitable land of Earth and then 58% of a second Earth as shown below.
A change in diet has substantial power to reduce the area of land required for agriculture by substitution of some of the most land intensive foods as you can see below.
Globally a transition to plant-based foods would reduce the demand for agricultural land by approximately 75%.8 The Australian diet is approximately 3.5 times more land intensive than the global average (169 M km2 cf. 48 M km2), so the reduction is even greater at 94%. This is based on the growing area shrinking from 2.4 hectares per person to just 0.2 hectares (2,000m2). This is a conservative value, almost double the average estimated by Ritchie at a global level.9 This is the area required on an ongoing basis. A further opportunity lies in reducing the rate of degradation due to erosion, salinity and acidification.
It is estimated at least 100 million hectares of land is lost world-wide to degradation every year.10 The Australian diet requires 3.5 times the global average. Australian soils are particularly susceptable to degradation.11 Thus it is reasonable to infer that the Australian share of the degradation is 3.5 times the global average, working out to 425m2 per person per year. With a 94% reduction in land use requirement, only the most suitable land need be used. We would therefore expect a commensurate reduction in degradation, saving approximately 400m2 per year equal to two hectares over 50 years. This has the potential to reduce land clearing pressure, preserving habitat as discussed in the respective section below.
Soil
Since European settlement in Australia, the rates of land degradation have increased from 5 to 50 times the historical rate, now vastly exceeding the rate of new soil development.12 This is primarily due to land clearing for agriculture13 and results in the release of vast stores of soil carbon. Lower tree cover and soil carbon cause an effectively permanent reduction in both productivity and water retention capacity.14 Global soil lost to erosion alone is estimated at approximately 24 billion tonnes per year (range 20 to 30 Gt).15 If evenly divided by population this would be 3.1 tonnes per person. Given the greater land requirements of the Australian diet this is far higher at 10.8 tonnes per year. The 94% reduction in land use required for a plant based diet means a saving of up to 10.2 tonnes of soil per year or 510 tonnes over 50 years.
Fresh Water
Australian agriculture consumed 5.7 trillion litres of fresh water in 2020-2116 or approximately 200,000 litres per person. This does not include rainwater falling or flowing directly onto fields, known as “green water”. Of this, approximately 27% was for grazing purposes or for cereals grown as animal feed. A further 13% was used for cereal production, of which more than two thirds is used for animal feed. Some of that water would be used for additional cereal and legume production required for a plant based diet.
Considering export ratios of animal products and all food production,17 the total annual agricultural water usage comes to approximately 174,000 litres per person.18 For a plant-based diet this falls to 121,000 litres, a saving of about 31%. Over fifty years this equates to almost 2.7 million litres per person. Further savings would be found in reduced cleaning requirements in the food processing and waste handling stages. Even more dramatic is the 59% reduction in green water consumption at almost 650,000 litres per year.
Fossil Fuels
In the early days of human agriculture, the energy a farmer and his human and animal workers put into growing food was substantially less than the energy contained in that food.19 Since the introduction of fossil fuels this has changed dramatically. The energy inputs from fossil fuels alone are up to forty times the energy contained in the food for some products and practices. Similarly the majority of feed is excreted, rather than converted into edible tissue as shown below.
| Grain fed : meat produced | Fossil fuel energy : protein energy | |
| kg : kg | kJ : kJ | |
| Beef | 13:1 | 40:1 |
| Eggs | 11:1 | 39:1 |
| Chickens | 2.3:1 | 4:1 |
The agricultural, fishing and forestry sector in Australia directly consumed 152 PJ of fossil fuels in 2023-24.21 A further 25 PJ were consumed on farms as electricity and 73 PJ in the cold supply chain.22 The grid was comprised of approximately 64% fossil energy in this period, equivalent to 63 PJ.23
Animal products dominate energy requirements in the sector due to:
- Feed cropping inefficiencies
- Fencing & water pumping large areas
- Cold chains & chilled processing
- Cleaning & sterilisation
- Large areas and remote areas
- Fishing fleets
In addition to fossil fuels for energy consumption, approximately one million tonnes of nitrogen fertiliser is sold in Australia per year.24 Nitrogen becomes the protein in the food, though most of it is lost in the supply chain. Less than half taken up by plants and then most of this lost as urine when used as animal feed as discussed below.25 It takes approximately 36 GJ of natural gas to produce one tonne of nitrogen fertiliser by the Haber Bosch process, while a further 15% of energy is required as electricity for auxilliary processes.26 Globally about half of electricity is from fossil sources. Together these add to approximately 39 PJ of fossil energy.
Combining direct fossil fuel use, gas used for fertiliser production and indirect fossil energy used for electricity brings the total to 254 PJ. This is the equivalent to 6.6 billion litres of diesel. Analysis of land use and nitrogen requirements on a global scale suggest savings of at least 70% of each for transition to plant based diets.27 This is unsurprising given the inefficiencies noted in the table above. One study reports that the ratio of fossil fuel use in the production of animal protein is six to twenty times that required for soy protein.28
I could not find a comprehensive diet level analysis separating fossil fuels from other emissions sources. In light of this I have conservatively allowed the same 70% reduction in fossil fuel use, comparable to the other resources. Australia exports approximately three quarters of all food produced,29 leaving potential annual per capita savings of 43L or 2,150L over 50 years. This is a surprisingly minor component of total fossil fuel consumption at less than 1%.30 As noted below most of the emmissions from agriculture are due to land use change and the digestion of cattle and sheep.
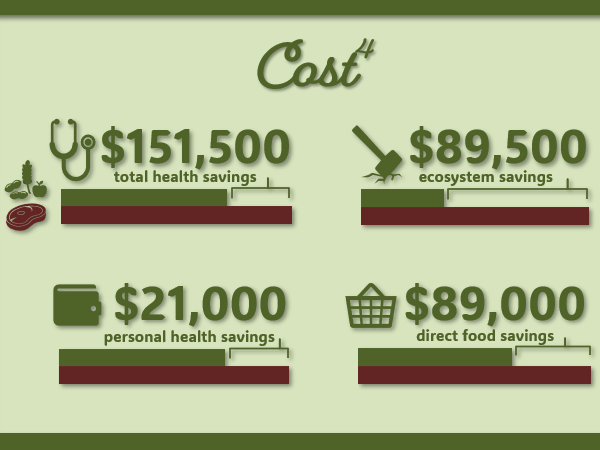
4. Costs
In this section all figures are given in 2025 Australian Dollars. Where figures were retrieved for different years or currencies they have been adjusted for inflation and purchasing power using international dollars.
Health and Environmental Externalities
The total health savings and total ecosystem savings are estimates of the costs avoided by pursuing a vegan diet. The value shown in the infographic is based on the difference in expected costs for society compared to a baseline omnivorous diet. Researchers estimated that for every $1 spent globally on food, there are $2 of externalised costs.31 They carried out detailed studies into both production and consumption related impacts and provide a breakdown for each country and a range of diets in their dataset, which I urge curious readers to explore.
From their dataset I calculated the annual externalised healthcare costs for Australians at $3,030 per person. Australia spent about $10,000 per person on healthcare in 2023-24.33 The estimated externalised costs therefore represent an opportunity to reduce healthcare spending by 30%, equivalent to 3% of total GDP.
Personal Healthcare Costs
According to a recent meta-analysis, out-of-pocket expenses for Australians average 14% of total healthcare costs.34 The value in the infographic was reached by multiplying this ratio by the total health related externalities provided for dietary change in the figure above. This is the equivalent of $420 per year.
Direct Cost Savings for Food
Researchers at Oxford University and Tufts University, Boston prepared detailed comparisons of costs across a range of diets for 150 different countries.35 Their supplementary data allows for a comparison on per-country basis. In Australia a vegan diet was found to be 34% cheaper than the omnivorous baseline. Our personal experience supports this. Some people may object to this, on the basis of pricing for meat-substitutes. Such products however, continue to play a minor, though growing role in average vegan diets. On the other hand dried legumes and other soy products remain significantly cheaper than meat and most dairy products.
The annual per capita food expense for the baseline is from the 2025 national figures divided by population.36 The average spend based on those figures is $5,225 per person, for an annual saving of $1,777. This is $21,000 over 50 years as shown in the infographic. Note that this is for grocery costs only. Dining out and food delivery services add further potential for savings, though I have not quantified those values.
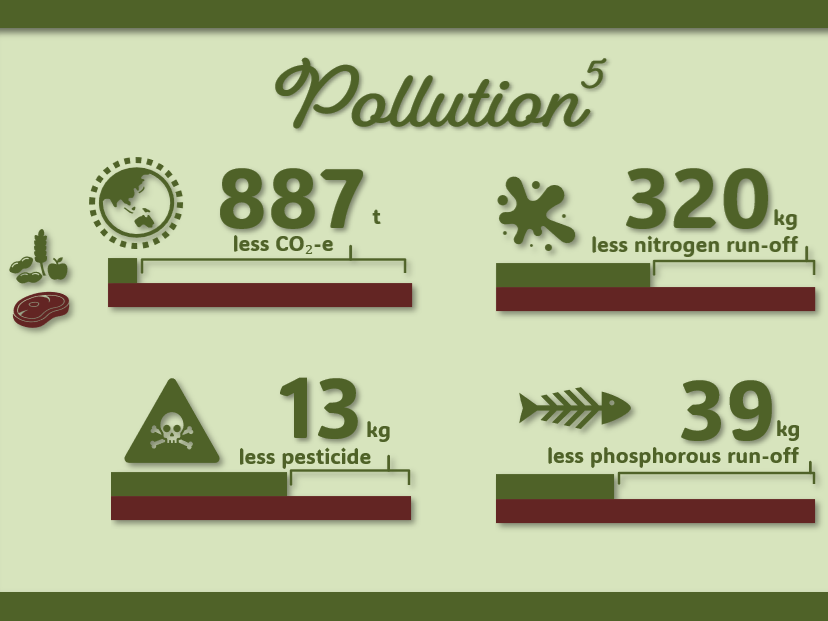
5. Pollution
The production of animals and animal products requires in the order of ten times the input compared to feeding people directly.37 This is due to the inherent inefficiency of the digestive process. Thus there is a substantial opportunity for reduction of both consumption and pollution.
Carbon Dioxide and other Green-house Gases
There are two separate, but related opportunities for reducing atmospheric green-house gases (GHGs) with diet.
The first opportunity is preventing the release of carbon dioxide, methane and nitrous oxides (emissions). These originate from:
- Land-clearing
- Fertiliser
- Feed production
- Digestive bi-products
- Manure
- Transport & equipment
- Refrigeration
- Processing and packaging
On farm emissions the largest component across the diet, primarily due to digestive bi-products and land clearing.38
The second opportunity is using the freed land to capture carbon from the atmosphere in trees and the soil (sequestration). For a 50% chance of keeping global warming below 1.5°C, we can emit no more than 17 tonnes more CO₂-e per person in total39. The current Australian average is 23 tonnes per year!
Researchers at Leiden University in the Netherlands found that dietary changes among the wealthiest nations would be adequate to meet per capita carbon reduction obligations, if the land freed was is used for sequestration.40
Preventing emissions
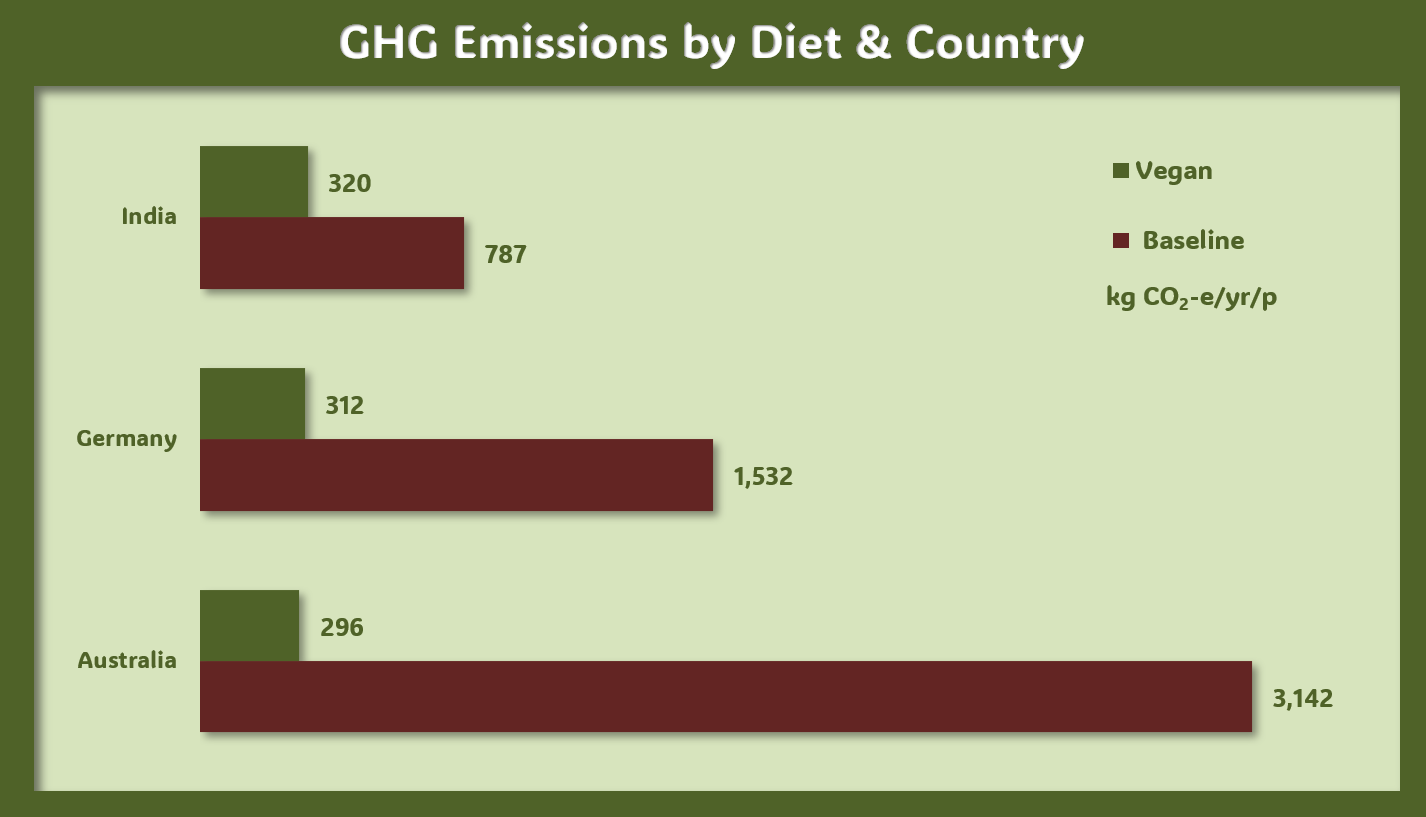
The average Australian diet has a footprint of 3.1 tonnes CO₂-e per year.41 This is substantially more than both global average and typical diets used in other reference studies.42 The high intake of beef and lamb which emit methane during digestion explains this as shown below.
A shift to a plant-based diet presents the potential for a 91% reduction in personal dietary emissions to just 296 kg CO₂-e / yr.43 Over fifty years this would keep 142 tonnes of CO₂-e out of the atmosphere. Since a substantial portion of this is relatively short-lived but powerful methane from beef and lamb, the effect on global temperatures in the near term would be signficant if widely adopted.
Sequestration opportunities
The clearing of land, primarily for agriculture, has reduced global carbon stores in plant-life by more than half, while the carbon in all our crops and livestock combined is just 2% of what it replaced.45 The central Queensland region referred to as the Brigalow belt remains a land-clearing hotspot, primarily for the expansion of grazing.46 Approximately 20% of land cleared is primary forest and the balance is reclearing of previously cleared areas. The emissions from clearing of primary forests is captured in the previous section as land-use change.
Rehabilitation of previously cleared areas offer the opportunity to draw carbon from the atmosphere. If those areas in the Brigalow belt are allowed to regrow, they offer the potential to capture between 3.3 and 5.5 tonnes of CO₂-e per hectare each year.47 Researchers have also identified areas of abandoned cropland in Southern Victoria undergoing natural afforestation with higher sequestration rates.48 Potential sequestration rates in South America, where soy is grown to feed animals averages 12 t CO₂-e/ha/yr.
There are 2.2 hectares freed from ongoing pressure by a vegan diet as noted in the resources section above. A further 2.0 hectares of land is saved from degradation over 50 years. However, the degraded land is saved only over the course of the whole 50 years at 400m2 per year. To reflect this as an anualised value, it has been averaged across the fifty years. This gives an equivalent of 1.0 hectare per year from avoided degradation for a total 3.2 hectares available for afforestation.
To remain conservative, just 10% of the area has been assumed to be in a high rainfall area, sequestering 10 t CO₂-e/ha/yr. The other 90% has been assumed be in the Brigalow belt or similar, low rainfall area, sequestering 4.0 t CO₂-e/ha/yr. For the 3.2 hectares this works out to an incredible total of 14.9 tonnes of CO₂-e per year.
As you can see, the sequestration potential vastly exceeds the direct dietary emissions. It is worth noting, however, that the long term sequestration potential of the Brigalow forest saturates at approximately 320 t CO₂-e/ha.49 It can also be released again suddenly in vast quantities by fire. This makes cutting emmissions a critical part of any long term solution.
The Australian government has recently put forth a plan to capture 119 million tonnes of CO₂-e by 2050 with just 4% of agricultural land, yet emphasis is made on the positive impacts to farmers.50 In my opinion this severely lacks ambition at just 4 tonnes total per person over 25 years. I expect it will require upward revision over coming years, based on current emmissions trajectories and emissions reductions obligations.
For more on the carbon opportunity costs of food, refer to this excellent summary by Hannah Ritchie.51
Nitrogen
Australia holds the record among studied countries for the greatest nitrogen footprint per person, with food production dominating this figure. 82% of food use is for animal products.52

In the best case scenario all nitrogen that actually makes it into food is rendered safe in the sewerage network. In that case so we need consider only the nitrogen used in animal production. With 33% of the meat produced in Australia consumed domestically,53 this represents an opportunity to reduce reactive nitrogen losses to the environment by approximately 8.1kg per year. Actual savings are likely to be higher due to the portion of cereal crops used for animal feed. This is comparable to the figure of 6.4kg calculated by Danish researchers based on their dietary context54 and 8.8kg per capita reported by US researchers.55 The lower, peer reviewed, value has been used in the infographic due to greater certainty in data quality compared to my manual calculation and the broad-sweeping US figure.
Phosphorous
Phosphorous is highly water soluable. Much of what is applied is carried into surface water and, like free nitrogen becomes problematic by encouraging eutrophic growth of algae. This consumes the dissolved oxygen in the water, making it unsuitable for anything else to live.
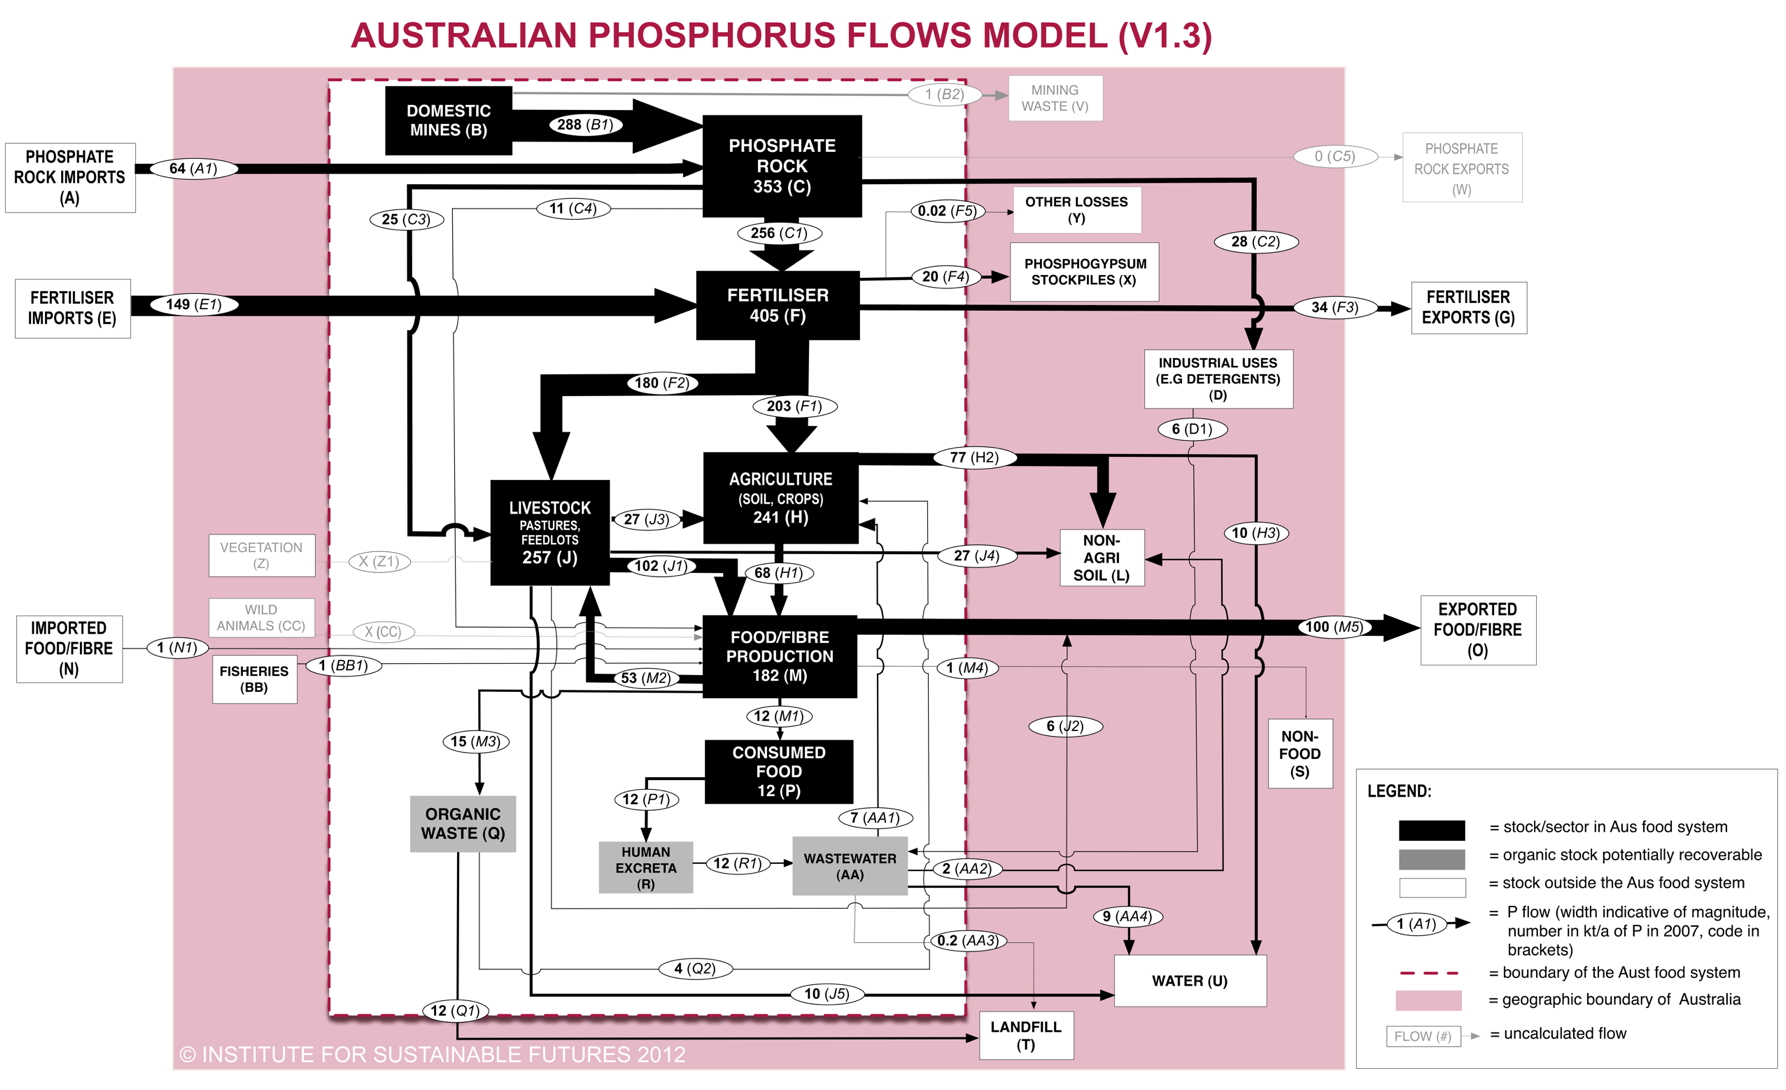
Australia is heavily dependent on phosphate fertilisers from both domestic and imported sources. As of 2007 it was the world’s fifth largest consumer of phosphate fertilisers despite being only the world’s 52nd largest country by population.56 In part this is due to the substantial food export balance, but it also signifies the low phosphate concentrations in Australia’s soils. By simple analysis the livestock sector accounts for 63% of Australia’s phosphorus demand. This is comparable to the global figure estimated at 72%.57 The difference is likely due to differences in the accounting of cereals, which are largely grown to feed livestock.58
The annual global flow of phosphorous to surface water is estimated at 9.7 million tonnes.59 If evenly divided by global population, a 63% reduction is equivalent to 0.78kg per person per year. To validate this I also looked at a detailed phosphorous flow model by Australian researchers shown below.60 When accounting only for the domestic consumption portion and divided by the population, this coincidentally shows the same waste flow of 0.78kg per person per year and 39kg over 50 years.
For reference, another study, based on the US diet, found a reduction of at least 75% for a meatless diet.62
Pesticides
The widespread application of pesticides for the protection of crops has had a devastating impact on insect populations. Recent estimates suggest that global insect biomass has declined by 47% between 1986 and 2020.63 Researchers in the US found that pesticide use in an ominivorous diet is 1.4 times that of a vegetarian diet.64 While a vegan diet is likely to invoke the use of even less, due to the higher efficiency, I was not able to find reliable figures.
Global production of the active ingredients in pesticide were estimated at 3.7 million tonnes in 202365. This is double what it was in 1990. Oceania, including Australia, holds the record for highest pesticide use per person at 2.44kg per person. I guess we are known for having the scariest bugs! When accounting for the export of three quarters of agricultural products66 this puts our consumption at 610g per person per year for the omnivorous diet. This would put the vegetarian diet at 350g, a saving of 260g per year or 8kg over 50 years.
6. Lives
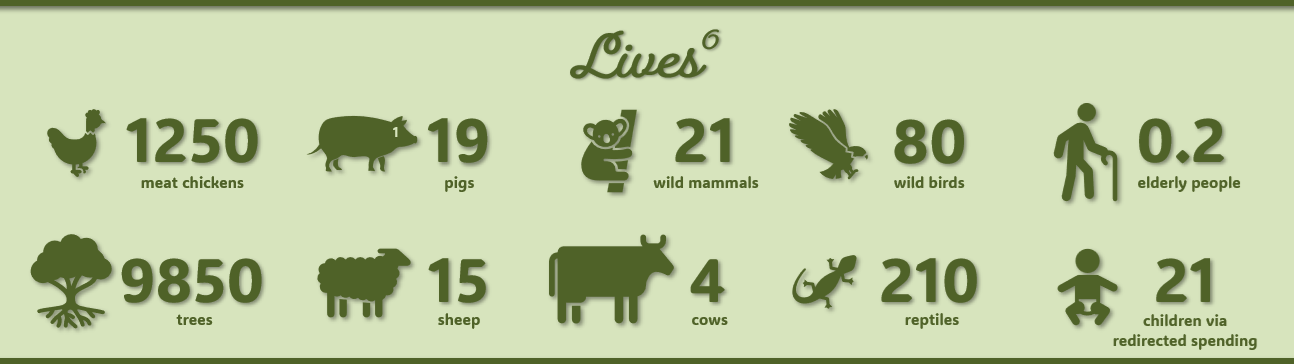
There are four different classes of lives in consideration in this section. The first is the lives of the trees and wild animals whose habitat would be restored or preserved. The second is the lives of domesticated animals, which need no longer exist due to the reduced demand. This amounts to more than simply preventing death, as the majority of these animals live in permanent suffering.67
The third is the lives of people who are indirectly affected by animal agriculture and who serve to benefit from the reduction in it’s ill effects. A further number are directly affected, but I have not sought to quantify them this time.
The final figure are the lives of the most disadvantaged people in the world, saved through redirected spending. This is not otherwise an inherent benefit of plant-based eating. I have used this approach throughout the What Difference series to demonstrate how much we can in-fact do with the choices at our disposal.
Wild Animals and Habitat
Across Australia, more than 400,000 hectares of native forest are cleared each year, mostly for conversion to grazing.68 This results in the long term deterioration of soil carbon, nitrogen and moisture retention ability as discussed above. It also results in the death or displacement of more than 100 million animals each year.69
The count of trees given is based on the low-end estimate of stem count for the Brigalow Belt region in Queensland at 1,885 stems per hectare.70 An alternative measure is total living biomass, which for the same region is 117 tonnes per hectare.
In both cases the total area considered is based on two components. One – the initial one-off reduction in land pressure which would be considered fully rehabilitated after 50 years. Two – the further area prevented from clearing each year due to degradation as discussed above.
Domesticated Animals
The figures given are based on the Australian average apparent consumption figures71 divided by estimated carcass weight. The list is not exhaustive and consideration should also be given to animals suffering though not killed for human consumption such as cage hens for eggs.
Humans
Researchers have identified the number of excess deaths expected based on projected temperature rise associated with each tonne of CO₂-e.72 They found that each death was associated with the addition of 4,434 t CO₂-e added to the atmosphere. The figure in the infographic is for elderly people, who are the most vulnerable to heat stress. This was calculated by dividing total emissions savings and sequestration potential by this value.
Further lives would be saved by improved health outcomes, due to reduced exposure to the hazards associated with animal agriculture. This includes pesticides as well as environmental hazards such as air pollution from nitrogen and increased natural disasters. I have not quantified these values at this stage.
The number of childrens lives saved is based on redirecting of the money saved on personal health and food spending costs to the most effective charities. As of the date of this post, the statistical cost to save one human life is $5,227 through donations to the Helen Keller Foundation.73 With the personal health savings at $21,000 and food $89,000 this is $110,000 over 50 years. Divided by the cost to save a life gives 21 lives. One could argue that the cost to save a life will increase as more lives are saved, and that could well be true. So could the savings from eating plants, as more of the world can afford meat and there is less productive land available to produce it.
Note that any money spent on saving lives could alternatively be spent on anything else the reader desires, but it would not produce the outcome identified on the infographic.
7. Basis of Comparison
The baseline for all figures, unless noted otherwise, is a typical Australian diet, based on average consumption figures. This is somewhat heavier in meat intake than those of many in-depth studies, which are largely based on European diets. The result of this is a greater magnitude in the impacts than commonly reported. While the title suggests only plants, the plant-based diet also includes mushrooms.
As an average which includes children and the elderly, the opportunities indicated under-estimate the impacts for some demographics. For instance adults and men in particular, consume more food in total and a higher percentage of meat than do women and children. The greater the total animal product intake, the greater the potential impacts.
The lower, meaty oloured bar on the bar charts show the baseline diet-related impact. The leafy coloured bar above is the impact of the plant-based option. The horizontal curly brace shows the improvement.
Beans for Beef: A halfway option that’s more than halfway there
So what if going 100% plant-based tomorrow is just too intimidating? You are not the only one. We have been working towards this for several years and our freegan activities, mean we still have meat now and again. This means we don’t get all the health benefits of a vegan diet. It does however, save us plenty of money and further reduces our other impacts by reducing total food demand and food going to landfill.
There is however, some steps you can take to start reducing impact right away. The first is to phase out beef and lamb altogether and cut back on dairy. The ruminant animals are responsible for the largest share of resource use and pollution. Do not simply shift to other other animal proteins though. Doing so increases animal suffering and shifts the land pressure to already depleted oceans and the troubled tropics.
Instead start adding more legumes and nuts to your diet. Tofu sucks for those new to it, especially if little effort goes into preparation. But once you start to learn a few tricks, it is an excellent flavour absorber and amazingly versatile for textures. Beans are an even better option, and once you learn to prepare, pressure cook and add the right amount of salt (after cooking) they can really be quite delicious. Check out this short video below for a few tips we learned along the way.
References
- Fadnes LT, Økland JM, Haaland ØA, Johansson KA (2022) Estimating impact of food choices on life expectancy: A modeling study. PLOS Medicine 19(2): e1003889. https://doi.org/10.1371/journal.pmed.1003889 ↩︎
- te Wierik, S., DeClerck, F., Beusen, A. et al. (2025) Identifying the safe operating space for food systems. Nat Food 6, 1153–1163. https://doi.org/10.1038/s43016-025-01252-6 ↩︎
- Ritchie, H. and Spooner, F. (2024) – “Large amounts of antibiotics are used in livestock, but several countries have shown this doesn’t have to be the case”. https://ourworldindata.org/antibiotics-livestock ↩︎
- Standing Committee on Agriculture (2023) Australian Food Story: Feeding the
Nation and Beyond, Chapter 3. Parliament of Australia. https://www.aph.gov.au/Parliamentary_Business/Committees/House/Former_Committees/Agriculture/FoodsecurityinAustrali/Report/Chapter_3_-_Food_production_consumption_and_export ↩︎ - te Wierik, S., DeClerck, F., Beusen, A. et al. (2025) Identifying the safe operating space for food systems. Nat Food 6, 1153–1163. https://doi.org/10.1038/s43016-025-01252-6 ↩︎
- ibid. ↩︎
- Bui, L., Pham, T., Wang, F. et al. (2024) Planetary Health Diet Index and risk of total and cause-specific mortality in three prospective cohorts,The American Journal of Clinical Nutrition, 120(1), https://doi.org/10.1016/j.ajcnut.2024.03.019 ↩︎
- Ritchie, H (2021) If the world adopted a plant-based diet, we would reduce global agricultural land use from 4 to 1 billion hectares. https://ourworldindata.org/land-use-diets. ↩︎
- Ibid. ↩︎
- United Nations Convention to Combat Desertification (2023) At least 100 million hectares of healthy land now lost each year (Press Release). https://www.unccd.int/news-stories/press-releases/least-100-million-hectares-healthy-land-now-lost-each-year ↩︎
- Lumb, M (2012) Land Degradation Fact Sheet, The Australian Collaboration, https://www.australiancollaboration.com.au/pdf/FactSheets/Land-degradation-FactSheet.pdf ↩︎
- Ibid. ↩︎
- Cresswell, I., Janke, T., Johnston, E. et al. (2021) Australian State of the Environment Report. Land Clearing Chapter. https://soe.dcceew.gov.au/land/pressures/industry#land-clearing ↩︎
- Kopittke, P. Menzies, N., Wang, P., et al. (2019) Soil and the intensification of agriculture for global food security,
Environment International, 132, https://doi.org/10.1016/j.envint.2019.105078 ↩︎ - Ibid. ↩︎
- Australian Bureau of Statistics. (2020-21). Water Use on Australian Farms. ABS. https://www.abs.gov.au/statistics/industry/agriculture/water-use-australian-farms/latest-release. ↩︎
- Standing Committee on Agriculture (2023) Australian Food Story: Feeding the
Nation and Beyond, Chapter 3. Parliament of Australia. https://www.aph.gov.au/Parliamentary_Business/Committees/House/Former_Committees/Agriculture/FoodsecurityinAustrali/Report/Chapter_3_-_Food_production_consumption_and_export ↩︎ - Kim, B. Santo, R. Scatterday, A. et al. (2020) Country-specific dietary shifts to mitigate climate and water crises,
Global Environmental Change, 62, https://doi.org/10.1016/j.gloenvcha.2019.05.010 ↩︎ - Sabaté, J. & Soret, S. (2014) Sustainability of plant-based diets: back to the future, The American Journal of Clinical Nutrition,
100 (1) https://doi.org/10.3945/ajcn.113.071522 ↩︎ - Ibid. ↩︎
- Australian Bureau of Statistics. (2023-24). Energy Account, Australia. ABS. https://www.abs.gov.au/statistics/industry/energy/energy-account-australia/latest-release ↩︎
- Brodribb, P., McCann, M. & Dewerson, G. (2023) Cold Hard Facts 2022, prepared for the Department of Climate Change, Energy, the Environment and Water, https://iifiir.org/en/documents/47827/download ↩︎
- Department of Climate Change, Energy, Water and the Environment (2025) Electricity Generation https://www.energy.gov.au/energy-data/australian-energy-statistics/electricity-generation ↩︎
- Fertilizer Australia (n.d.) Australian Fertilizer Market, https://fertilizer.org.au/about-fertiliser/the-fertiliser-industry/australian-fertilizer-market ↩︎
- Rosa, L. and Gabrielli, P. (2023) Energy and food security implications of transitioning synthetic nitrogen fertilizers to net-zero emissions Environ. Res. Lett. 18 014008. https://doi.org/10.1088/1748-9326/aca815 ↩︎
- Seyedehhoma, G. et al. (2021) Sustainable Ammonia Production Processes, Frontiers in Energy Research, 9. https://doi.org/10.3389/fenrg.2021.580808 ↩︎
- Davis, K., et al. (2016) Meeting future food demand with current agricultural resources, Global Environmental Change, 39, https://doi.org/10.1016/j.gloenvcha.2016.05.004 ↩︎
- Reijnders, L. and Soret, S. (2003) Quantification of the environmental impact of different dietary protein choices, The American Journal of Clinical Nutrition, 78 (3), https://doi.org/10.1093/ajcn/78.3.664S ↩︎
- ABARES (2025), Agricultural Commodities Report:
December quarter 2025, ABARES, Canberra, DOI: https://doi.org/10.25814/seg6-pk47 ↩︎ - Australian Bureau of Statistics. (2023-24). Energy Account, Australia. ABS. https://www.abs.gov.au/statistics/industry/energy/energy-account-australia/latest-release ↩︎
- Lucas, E., Guo, M. & Guillén-Gosálbez, G. (2023) Low-carbon diets can reduce global ecological and health costs. Nat Food 4, 394–406. https://doi.org/10.1038/s43016-023-00749-2 ↩︎
- Ibid. ↩︎
- Australian Institute of Health and Welfare. (2025). Health expenditure Australia 2023–24 . https://www.aihw.gov.au/reports/health-welfare-expenditure/health-expenditure-australia-2023-24 ↩︎
- Desborough, J. et al. (2025) Lived experience of out-of-pocket costs of health care and medicines by people with chronic conditions and their families in Australia: a systematic review of the qualitative literature, Health Policy, 158, https://doi.org/10.1016/j.healthpol.2025.105359 ↩︎
- Springmann, M. et al. (2021) The global and regional costs of healthy and sustainable dietary patterns: a modelling study. The Lancet. Planetary health vol. 5,11: e797-e807. https://doi.org/10.1016/S2542-5196(21)00251-5 ↩︎
- CEIC Data (2025) Australia Household Spending: Food from ABS, https://www.ceicdata.com/en/australia/household-spending-by-industry/household-spending-food ↩︎
- Sabaté, J. & Soret, S. (2014) Sustainability of plant-based diets: back to the future, The American Journal of Clinical Nutrition,
100 (1) https://doi.org/10.3945/ajcn.113.071522 ↩︎ - Ritchie, H. (2020) You want to reduce the carbon footprint of your food? Focus on what you eat, not whether your food is local. https://ourworldindata.org/food-choice-vs-eating-local ↩︎
- Damon Matthews, H., Tokarska, K.B., Rogelj, J. et al. (2021) An integrated approach to quantifying uncertainties in the remaining carbon budget. Commun Earth Environ 2, 7 https://doi.org/10.1038/s43247-020-00064-9;
Lamboll, R. (2025). Indicators of Global Climate Change 2024 (v2025.05.02). Zenodo. https://doi.org/10.5281/zenodo.15327155 ↩︎ - Sun, Z., Scherer, L., Tukker, A. et al. (2022) Dietary change in high-income nations alone can lead to substantial double climate dividend. Nat Food 3, 29–37. https://doi.org/10.1038/s43016-021-00431-5 ↩︎
- Kim, B., Santo, R., Scatterday, A. et al. (2020) Country-specific dietary shifts to mitigate climate and water crises,
Global Environmental Change, 62, https://doi.org/10.1016/j.gloenvcha.2019.05.010. ↩︎ - Alcalá-Santiago, A. et al. (2025) Nutrient adequacy and environmental foot-print of Mediterranean, pesco-, ovo-lacto-, and vegan menus: a modelling study, Frontiers in Nutrition, 12, https://www.frontiersin.org/journals/nutrition/articles/10.3389/fnut.2025.1681512/full ↩︎
- Kim, B. Santo, R. Scatterday, A. et al. (2020) Country-specific dietary shifts to mitigate climate and water crises,
Global Environmental Change, 62, https://doi.org/10.1016/j.gloenvcha.2019.05.010. ↩︎ - Ibid. ↩︎
- Bar-On, Y.M. Phillips, R. & Milo, R. (2018) The biomass distribution on Earth, Proc. Natl. Acad. Sci. U.S.A. 115 (25) 6506-6511, https://doi.org/10.1073/pnas.1711842115. ↩︎
- Cresswell, I., Janke, T., Johnston, E. et al. (2021) Australian State of the Environment Report. Land Clearing Chapter. https://soe.dcceew.gov.au/land/pressures/industry#land-clearing ↩︎
- Peeters, P. & Butler, D. (2014) Brigalow: regrowth benefits management guideline. Department of Science,
Information Technology, Innovation and the Arts, https://www.publications.qld.gov.au/dataset/423dafdb-be26-4aba-b225-1fab3495f7bf/resource/fc1884f2-4793-4407-aff5-b07333045ed1/download/brigalow-regrowth-mgmt-guideline.pdf; Fitch, P. et al. (2022) Australia’s Sequestration Potential, CSIRO, https://www.csiro.au/-/media/Missions/TNZ/CCA-report/CCA-Report-Australias-Potential-Sequestration-Final-28-November-2022.pdf ↩︎ - Gvein, M.H., Hu, X., Næss, J.S. et al. (2023) Potential of land-based climate change mitigation strategies on abandoned cropland. Commun Earth Environ 4, 39. https://doi.org/10.1038/s43247-023-00696-7 ↩︎
- Peeters, P. & Butler, D. (2014) Brigalow: regrowth benefits management guideline. Department of Science,
Information Technology, Innovation and the Arts, https://www.publications.qld.gov.au/dataset/423dafdb-be26-4aba-b225-1fab3495f7bf/resource/fc1884f2-4793-4407-aff5-b07333045ed1/download/brigalow-regrowth-mgmt-guideline.pdf; ↩︎ - Whittle, L., Hone, S., Morris, L., et al. (2025), ABARES Insights – Sequestration on Agricultural Land:
Impacts and Policy Trade-offs, Issue 8, December. https://doi.org/10.25814/8b28-1507 ↩︎ - Ritchie, H. (2021) What are the carbon opportunity costs of our food? https://ourworldindata.org/carbon-opportunity-costs-food ↩︎
- Liang, X., Leach, A., Galloway, J. et al. (2016) Beef and coal are key drivers of Australia’s high nitrogen footprint. Sci Rep 6, 39644. https://doi.org/10.1038/srep39644 ↩︎
- Standing Committee on Agriculture (2023) Australian Food Story: Feeding the
Nation and Beyond, Chapter 3. Parliament of Australia. https://www.aph.gov.au/Parliamentary_Business/Committees/House/Former_Committees/Agriculture/FoodsecurityinAustrali/Report/Chapter_3_-_Food_production_consumption_and_export ↩︎ - Serrano, T., et al. (2025) Communicating the environmental impacts of individual actions in the context of Planetary Boundaries, Sustainable Production and Consumption, 56, https://doi.org/10.1016/j.spc.2025.03.021. ↩︎
- Davis, K., et al. (2016) Meeting future food demand with current agricultural resources, Global Environmental Change, 39, https://doi.org/10.1016/j.gloenvcha.2016.05.004. ↩︎
- Cordell, D. Jackson, M. White, S. (2013) Phosphorus flows through the Australian food system: Identifying intervention points as a roadmap to phosphorus security, Environmental Science & Policy, (29), https://doi.org/10.1016/j.envsci.2013.01.008. ↩︎
- Metson, G. et al. (2014), Phosphorus is a key component of the resource demands for meat, eggs, and dairy production in the United States, Proc. Natl. Acad. Sci. U.S.A. 111 (46) E4906-E4907, https://doi.org/10.1073/pnas.1417759111 ↩︎
- ABARES (2025), Agricultural Commodities Report:
December quarter 2025, ABARES, Canberra, DOI: https://doi.org/10.25814/seg6-pk47 ↩︎ - te Wierik, S., DeClerck, F., Beusen, A. et al. (2025) Identifying the safe operating space for food systems. Nat Food 6, 1153–1163. https://doi.org/10.1038/s43016-025-01252-6 ↩︎
- Cordell, D. et al. (2012) Analysis of phosphorus flows through the Australian food production and consumption system, Australian Sustainable Phosphorus Futures, Institute for Sustainable Futures, prepared forRural Industries Research & Development Corporation. https://phosphorusfutures.net/phosphorus-flows-through-the-australian-food-system/ ↩︎
- Ibid. ↩︎
- Schroeder, J. (2018). Phosphorus Impacts from Meat-, Dairy-, and Plant-Based Diets. Consilience, (19). https://doi.org/10.7916/consilience.v0i19.3875 ↩︎
- Dalton, R., et al. (2023). Long-Term Declines in Insect Abundance and Biomass in a Subalpine Habitat. Ecosphere 14(8): e4620. https://doi.org/10.1002/ecs2.4620 ↩︎
- Marlow, H. et al. (2009) Diet and the environment: does what you eat matter? The American Journal of Clinical Nutrition, 89 (5), https://doi.org/10.3945/ajcn.2009.26736Z ↩︎
- FAO. (2025) Pesticides use and trade – 1990–2023. FAOSTAT Analytical Briefs, No. 109. Rome. https://doi.org/10.4060/cd5968en ↩︎
- ABARES (2025), Agricultural Commodities Report:
December quarter 2025, ABARES, Canberra, DOI: https://doi.org/10.25814/seg6-pk47 ↩︎ - Anomaly J. (2015). What’s Wrong With Factory Farming?. Public health ethics, 8(3), 246–254. https://doi.org/10.1093/phe/phu001 ↩︎
- Cresswell, I., Janke, T., Johnston, E. et al. (2021) Australian State of the Environment Report. Land Clearing Chapter. https://soe.dcceew.gov.au/land/pressures/industry#land-clearing ↩︎
- Taylor, M., Paterson, M. & Derkley, T. (2024) The ongoing animal welfare crisis from deforestation in Australia, https://www.greenpeace.org.au/static/planet4-australiapacific-stateless/2024/07/a7936650-rspca-greenpeace-deforestation-report-2024-web.pdf ↩︎
- Peeters, P. & Butler, D. (2014) Brigalow: regrowth benefits management guideline. Department of Science,
Information Technology, Innovation and the Arts, https://www.publications.qld.gov.au/dataset/423dafdb-be26-4aba-b225-1fab3495f7bf/resource/fc1884f2-4793-4407-aff5-b07333045ed1/download/brigalow-regrowth-mgmt-guideline.pdf; ↩︎ - Standing Committee on Agriculture (2023) Australian Food Story: Feeding the
Nation and Beyond, Chapter 3. Parliament of Australia. https://www.aph.gov.au/Parliamentary_Business/Committees/House/Former_Committees/Agriculture/FoodsecurityinAustrali/Report/Chapter_3_-_Food_production_consumption_and_export ↩︎ - Bressler, R. (2020) The Mortality Cost of Carbon, Nature Communications, 12 (1), https://doi.org/10.1038/s41467-021-24487-w ↩︎
- TLYCS (2025) Impact Calculator, https://www.thelifeyoucansave.org.au/impact-calculator/ ↩︎
Another fun calculator covering some of the same items, with a diffeent set of assumptions can be found here.
Impressive work – thank you for this!
J
Thank you. Please share widely if you found it helpful.